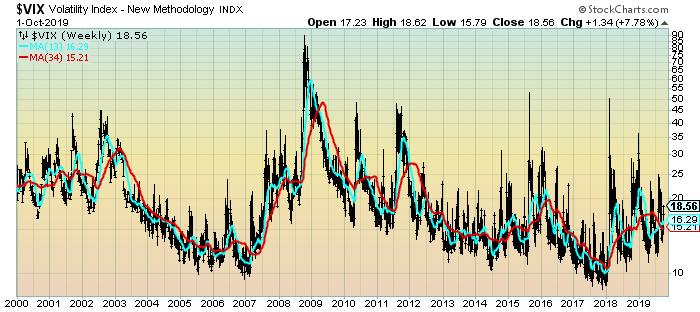
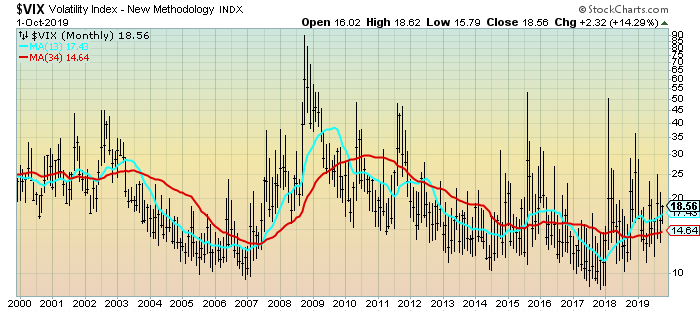
For reference purposes, below are two charts of the VIX from year 2000 through Monday’s (October 1, 2019) close, which had a closing value of 18.56.
Here is the VIX Weekly chart, depicted on a LOG scale, with the 13- and 34-week moving averages, seen in the cyan and red lines, respectively:
(click on chart to enlarge image)(chart courtesy of StockCharts.com; chart creation and annotation by the author)
–
Here is the VIX Monthly chart, depicted on a LOG scale, with the 13- and 34-month moving average, seen in the cyan and red lines, respectively:
(click on chart to enlarge image)(chart courtesy of StockCharts.com; chart creation and annotation by the author)
____
The Special Note summarizes my overall thoughts about our economic situation
SPX at 2940.25 as this post is written
The post VIX Weekly And Monthly Charts Since The Year 2000 – October 2, 2019 Update appeared first on EconomicGreenfield.